Evidence-Based Practice
Evidence-Based Practice
The traditional sanitizer is only alcohol. Alcohol is anti-microbial while wet but not after evaporation. The surface subsequently vulnerable to antimicrobials.
Spray Away D.O.A. is an unique formulation of alcohol with PCA crystals in solution.
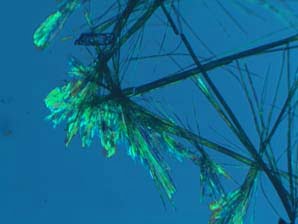
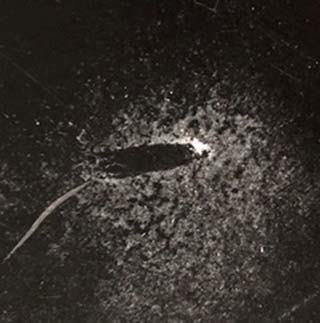
After the immediate anti-microbial benefits of ethanol has evaporated there remains a coating of PCA crystals on the surface for a continuing anti-microbial effect.
This is best demonstrated when one sprays the Spray Away D.O.A. solution on a surface that readily shows the crystals after evaporation of the alcohol.
BioFilm Destroyer: The WuXiapptec Laboratory of Marietta GA confirmed that a residual coating on metal and cloth resulted in destroying the biofilms of MRSA and Pseudomonas on contact via the ASTM E-2647 Drip Flow Biofilm Reactor.
This evidence supported the granting of the following US patent: 10,004, 705; Antimicrobials and methods of use. 8/26/2018.
Two Separate Independent Contract Laboratory Testing
Live SARS CoV2 Independent Contract Laboratory Testing: The experimental model was such that it replicated the clinical mitigation procedure for sanitizing and or disinfection of surfaces with a coating of protocatechuic acid crystals.
Hypothesis: The residual coating of protocatechuic acid crystals on the surface of an article would inactive the live SARS CoV2 virus upon contact.
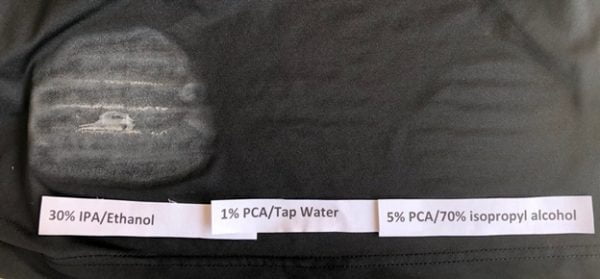
Preliminary Proof of Principle Test: The clinical application will be a 1% PCA solution. Despite instructions, it is anticipated the use by the subject will vary greatly in method: distance from the target, area on the target, movement while spraying, number of sprays, and or frequency of use.
Therefore, in anticipation of such the following test was performed using a 1% solution sprayed at the same site; 1, 2, and 3 times. After the immediate anti-microbial benefits of ethanol have evaporated there remains a coating of PCA crystals on the surface for a continuing antimicrobial effect.
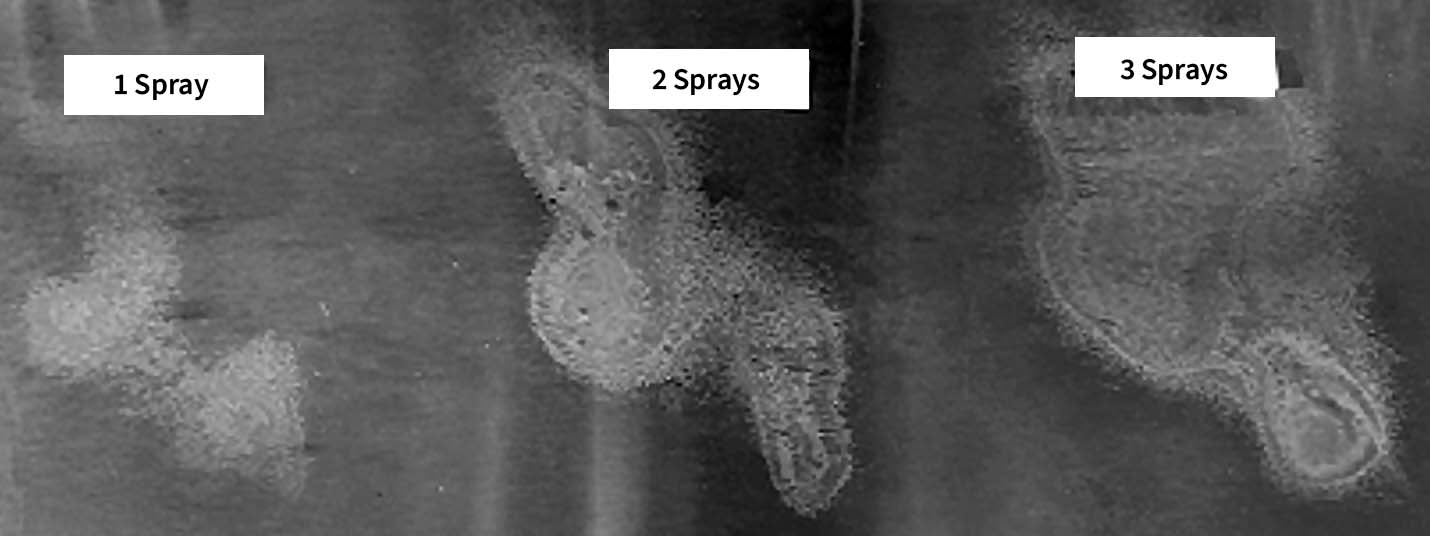
This showed the dispersion and concentration of the residual PCA crystalline coating. The concentration of the coating increased with the repeated application but the percentage dose remained 100% on its surface.
Materials: An alcoholic liquid solution containing 30% PCA in a spray container. One-inch square articles of metal, plastic, and N95 cloth.
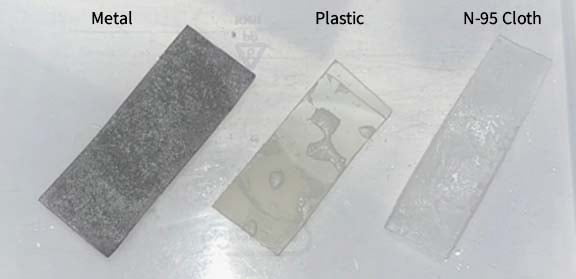
Method: The delivery replicated the clinical application. Each of the three articles was sprayed with a PCA solution. *The PCA solution was independently recommended by both laboratories to ensure a uniform method and amount of coating the surface of the articles in these studies.
The alcohol was allowed to dry. Since it is known that the alcohol while wet has an antimicrobial effect thereby creating an antimicrobial surface, but none after evaporation.
Upon evaporation, there remains a 100% PCA crystalline coating on the respective article. The live SARS CoV2 virus in an aqueous droplet was placed on the coated surface thereby replicating the clinical route of pathogenesis to a PCA coated surface.
Results: See each laboratory results below with 90-99.99% inactivation of the live SARS CoV-2 virus on contact with the residual PCA crystals.
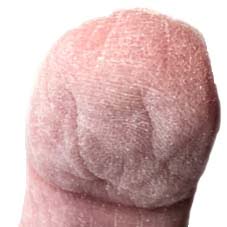
Discussion: The PCA crystalline coating inactivated the SARS CoV2 virus on contact. These laboratory studies replicated the clinical use; a coating of PCA on a surface will inactivate the live SARS CoV2 virus on contact. This would be true for PCA coating on top of the skin surface and or PCA attached to hairs.
A solution of PCA was used as a practical means of delivering the crystalline coating to the surface. The topical clinical application of dry crystals to a surface is impractical and would not insure the same uniform coating as when delivered in a liquid solution.
The dose is 100%; the crystals on the surface. As little as 1% solution of PCA will coat a surface as shown in the preliminary proof of principle test.
This explanation should clear any confusion concerning the resultant dose which is 100% crystals. There can be some confusion for those using traditional dose assessing conventional prescription concentrations. The delivery solution percentage is independent of the dose which is the resultant coating of the crystals on the surface.
Illinois Technical Institute
July 17, 2020 | Study 2969001001001: Testing Protocatechuic Acid (PCA) as a Possible Treatment Against SARS-CoV-2 Infected cells in vitro
Dear Dr. Johnson,
The study investigation (Study # 2969001001001) of the effectiveness of Protocatechuic Acid (PCA) against SARS-CoV-2, the causative virus for COVID19 has been completed. Testing of the PCA was initiated on June 16, 2020.
Test Article and Test Substrate identification and preparation
The Test Article (TA) used for this study was Protocatechuic Acid (PCA) and was provided by the Sponsor. The TA was received as an off-white powder. The PCA solution was prepared to be 30% PCA w/v in Ethanol. The PCA was prepared in 5g increments to pre-warmed 50-60 mL ethanol until dissolved for a total of 30g PCA in the solution. Additional ethanol was then added volumetrically to be equivalent to 100mL.
The Test Substrates (TS) were a Plastic-type material sourced from a clear plastic laboratory bottle (Corning 431731 Octagonal bottle, 150mL), cloth (the top layer of a N95 mask [3M 8210]), and a Sponsor-provided wire mesh to serve as a substrate for the TA. All test substrates were cut to approximately 1”x 1” in size. The test substrates were submerged into the PCA solution and dried horizontally to allow for even coating. After the substrate was thoroughly dried, the test substrate was re-submerged into the PCA solution for an additional coating.
Test Virus and Cell Culture
The Test Virus used for this study was 2019 Novel Coronavirus, Isolate USA-WA1/2020 (SARS-CoV-2). The virus was stored at approximately ≤ -65°C prior to use. The multiplicity of infection (MOI) was 0.01 TCID50/cell.
The Cell Culture used for the TCID50 test was African Green Monkey Kidney Cells (Vero E6 cells) that were maintained in Dulbecco’s Minimum Essential Medium with 10% fetal calf serum (DMEM-2). All growth media contained heat-inactivated fetal calf serum and antibiotics.
Study Design:
The test design is shown below in Table 1. This test will assess the TA on a substrate in various conditions as shown in Table 1.
- The Test Substrates were coated with PCA as described above. The test substrates were treated with PCA twice and allowed to fully dry overnight. In general, the time from the first coat to the next day’s virus exposure was approximately 24 hours and the second coat was applied approximately 203 hours later. Total time between the final PCA coat to the initiation of the study was approximately 21-22 hours. The coated test substrates were stored in a Safety Hood that was continuously operating until the initiation of the study.
- The PCA-treated Test Substrate was placed into a sterile 6 well cell culture plate and approximately 100 µL total of a ≥1 x 10⁶ TCID50/mL SARS-CoV-2 virus was such that 50 µL of virus was layered on each sides of the treated test substrates. This was the procedure used for the initial Day 1 experiment. For the Day 2 test, in an attempt to increase the recorded titer of the controls, the treated test substrate plus TA was placed into a sterile 6 well cell culture plate and the same amount of virus was layered onto both sides of the test substrate. However, an addition 50 µL of DMEM was added to each side to reduce the inactivation of the virus due to desiccation. Additionally, a glass coverslip was also added to help mitigate against evaporation. The Day 2 test also served as a confirmatory for the Day 1 test. Note: In comparison between the Day 1 test to the Day 2 test procedures, the Day 1 test, examined the inactivation of the virus in an environment with less humidity/moisture than the Day 2 confirmatory test which was modified to have 100 µL (50 µL per side) extra DMEM and a cover slip to mitigate against evaporation.
- After application of the virus, the virus was contact with the test substrates for approximately 10 minutes (Groups 1, 2, and 3, Control groups 7, 8, and 9), 60 minutes (Groups 4, 5, and 6, Control Groups 10, 11, and 12). Each substrate per time per test article was performed in duplicate. A cell culture-only control was included to indicate that cells without any TA or virus remain healthy throughout the assay. Virus-only controls without substrate was added for each time point to verify that the assay was performing as expected.
- After the incubation time, the treated substrates and control substrates were washed with 1 mL of cell culture media (DMEM-2) for approximately 5-10 minutes within the 6-well cell culture plate and the glass cover slip removed if necessary. This was the equivalent to a 10-fold dilution. The plate was gently stirred via an orbital shaker to enhance the recovery of the virus.
- For the TCID50, the cell culture media (DMEM-2) used to wash the test substrate was serially diluted 10 fold and transferred into respective wells of a 96-well plate which contained a monolayer of African Green Monkey Kidney Cells (Vero E6 cells) for titration. The TCID50 assay was performed non-GLP according to IITRI Standard Operating Procedures for the assay. The TCID50 titers were calculated using the method of Reed-Meunch.
Table 1: Study Design
| Group | Test and Control Groups | PCA |
| 1 | Plastic (10-minute exposure) | 2 replicates |
| 2 | Cloth (10-minute exposure) | 2 replicates |
| 3 | Mesh (10-minute exposure) | 2 replicates |
| 4 | Plastic (60-minute exposure) | 2 replicates |
| 5 | Cloth (60-minute exposure) | 2 replicates |
| 6 | Mesh (60-minute exposure) | 2 replicates |
| 7 | Virus Control- Plastic (10-minute exposure) | 2 replicates |
| 8 | Virus Control- Cloth (10-minute exposure) | 2 replicates |
| 9 | Virus Control- Mesh (10-minute exposure) | 2 replicates |
| 10 | Virus Control- Plastic (60-minute exposure) | 2 replicates |
| 11 | Virus Control-Cloth (60-minute exposure) | 2 replicates |
| 12 | Virus Control-Mesh (60-minute exposure) | 2 replicates |
Results:
The test article, test substrates and virus (SARS-CoV-2) were prepared according to protocol and each preparation was noted in the study notebook for this study.
Two experimental days were run for this study with the second day as run as a confirmatory. For Day 1, after coating the test substrates with PCA as described above (Groups shown in Table 1 above), a TCID50 was performed at 10 minutes or 60 minutes after initial application of the virus. There was an observed log difference between the experimental groups (Group 1: Plastic-10 min, Group 2: Cloth-10 min, Group 3: Mesh-10 min, Group 7: Plastic-60 min, Group 8: Cloth-60 min, Group 9: Mesh-60 min ) when compared to the controls (Group 4: Plastic-10 min, Group 5: Cloth-10 min, Group 6: Mesh-10 min, Group 10:Plastic-60 min, Group 11: Cloth-60 min, Group 12: Mesh-60 min).
Observed Day 1 results did indicate some log reductions in infectious virus titers under the experimental conditions performed for this study when compared to controls. The results are shown below in Table 2.
Table 2: Initial Experimental Run Results.
| Group | Test Article/substrate | Replicate | Incubation time | TCID50 Log10/mL* | Log average | St.Dev. | log difference^ |
| 1 | PCA/plastic | 1 | 10 Min | 3.75 | 3.75 | 0.00 | -0.63 |
| PCA/plastic | 2 | 10 min | 3.75 | ||||
| 2 | PCA/Cloth | 1 | 10 min | 2.75 | 2.75 | 0.00 | -1.25 |
| PCA/Cloth | 2 | 10 min | 2.75 | ||||
| 3 | PCA/Mesh | 1 | 10 min | 3.50 | 3.38 | 0.18 | -0.25 |
| PCA/Mesh | 2 | 10 min | 3.25 | ||||
| 4 | Control/plastic | 1 | 10 Min | 3.75 | 4.38 | 0.88 | N/A |
| Control/plastic | 2 | 10 min | 5.00 | ||||
| 5 | Control/Cloth | 1 | 10 min | 3.75 | 4.00 | 0.35 | N/A |
| Control/Cloth | 2 | 10 min | 4.25 | ||||
| 6 | Control/Mesh | 1 | 10 min | 3.75 | 3.63 | 0.18 | N/A |
| Control/Mesh | 2 | 10 min | 3.50 | ||||
| 7 | PCA/plastic | 1 | 60 Min | 3.25 | 2.88 | 0.53 | -1.13 |
| PCA/plastic | 2 | 60 Min | 2.50 | ||||
| 8 | PCA/Cloth | 1 | 60 Min | 2.50 | 2.75 | 0.35 | -1.00 |
| PCA/Cloth | 2 | 60 Min | 3.00 | ||||
| 9 | PCA/Mesh | 1 | 60 Min | 1.00 | 1.50 | 0.71 | -2.00 |
| PCA/Mesh | 2 | 60 Min | 2.00 | ||||
| 10 | Control/plastic | 1 | 60 Min | 3.75 | 4.00 | 0.35 | N/A |
| Control/plastic | 2 | 60 Min | 4.25 | ||||
| 11 | Control/Cloth | 1 | 60 Min | 4.00 | 3.75 | 0.35 | N/A |
| Control/Cloth | 2 | 60 Min | 3.50 | ||||
| 12 | Control/Mesh | 1 | 60 Min | 3.25 | 3.50 | 0.35 | N/A |
| Control/Mesh | 2 | 60 Min | 3.75 | ||||
| 13 | Virus control (no coupon) | N/A | 10 min | 5.75 | N/A | N/A | N/A |
| 14 | Virus control (no coupon) | N/A | 60 min | 5.75 | N/A | N/A | N/A |
^Log difference is defined as the averaged TCID50 Log10/mL from virus control on substrates – TCID50 Log10/mL from replicate test group. Log difference indicates amount of reduction in infectious virus when comparing the virus control on substrate to the test group.
For Day 2, after coating the test substrates with PCA as described above (Groups shown in Table 1 above), a TCID50 was performed at 10 minutes or 60 minutes after initial application of the virus. There was a modification to the procedures to see if the viral titers could be increased. The Day 2 test as an attempt to mitigate against the drying effect observed in the Day 1 test had modifications that included adding an additional 50 µl of DMEM on each side of the test substrate and a glass coverslip placed on top of the test substrate, thereby creating a more aqueous environment than the Day 1 run. As with the Day 1 run, there was an observed log difference between the experimental groups (Group1: Plastic-10 min, Group 2: Cloth-10 min, Group 3: Mesh-10 min, Group 7:Plastic-60 min, Group 8: Cloth-60 min, Group 9: Mesh-60 min ) when compared to the controls (Group 4:Plastic-10 min, Group 5: Cloth-10 min, Group 6: Mesh-10 min, Group 10:Plastic-60 min, Group 11: Cloth-60 min, Group 12: Mesh-60 min ) as shown in Table 3, thereby confirming the log differences observed from the Day 1 run.
Table 3: Confirmatory Experimental Run Results.
| Group | Test Article/substrate | Replicate | Incubation time | TCID50 Log10/mL* | Log average | St.Dev. | log difference^ |
| 1 | PCA/plastic | 1 | 10 Min | 4.25 | 4.38 | 0.18 | -1.13 |
| PCA/plastic | 2 | 10 min | 4.50 | ||||
| 2 | PCA/Cloth | 1 | 10 min | 4.25 | 4.25 | 0.00 | -1.13 |
| PCA/Cloth | 2 | 10 min | 4.25 | ||||
| 3 | PCA/Mesh | 1 | 10 min | 4.75 | 4.63 | 0.18 | -1.13 |
| PCA/Mesh | 2 | 10 min | 4.50 | ||||
| 4 | Control/plastic | 1 | 10 Min | 5.50 | 5.50 | 0.00 | N/A |
| Control/plastic | 2 | 10 min | 5.50 | ||||
| 5 | Control/Cloth | 1 | 10 min | 5.50 | 5.38 | 0.18 | N/A |
| Control/Cloth | 2 | 10 min | 5.25 | ||||
| 6 | Control/Mesh | 1 | 10 min | 5.75 | 5.75 | 0.00 | N/A |
| Control/Mesh | 2 | 10 min | 5.75 | ||||
| 7 | PCA/plastic | 1 | 60 Min | 3.50 | 3.63 | 0.18 | -1.50 |
| PCA/plastic | 2 | 60 Min | 3.75 | ||||
| 8 | PCA/Cloth | 1 | 60 Min | 2.00 | 2.75 | 1.06 | -2.38 |
| PCA/Cloth | 2 | 60 Min | 3.50 | ||||
| 9 | PCA/Mesh | 1 | 60 Min | 4.50 | 4.38 | 0.18 | -0.88 |
| PCA/Mesh | 2 | 60 Min | 4.25 | ||||
| 10 | Control/plastic | 1 | 60 Min | 5.00 | 5.13 | 0.18 | N/A |
| Control/plastic | 2 | 60 Min | 5.25 | ||||
| 11 | Control/Cloth | 1 | 60 Min | 4.50 | 5.13 | 0.88 | N/A |
| Control/Cloth | 2 | 60 Min | 5.75 | ||||
| 12 | Control/Mesh | 1 | 60 Min | 5.25 | 5.25 | 0.00 | N/A |
| Control/Mesh | 2 | 60 Min | 5.25 | ||||
| 13 | Virus control (no coupon) | N/A | 10 min | 5.75 | N/A | N/A | N/A |
| 14 | Virus control (no coupon) | N/A | 60 min | 5.75 | N/A | N/A | N/A |
*limit of detection is 1.5 TCID50 Log10/mL
^Log difference is defined as the averaged TCID50 Log10/mL from virus control on substrates – TCID50 Log10/mL from replicate test group. Log difference indicates amount of reduction in infectious virus when comparing the virus control on substrate to the test group.
Table 4, below, compares the Day 1 results with the Confirmatory.
Table 4: Comparison between Day 1 and Day 2 Runs
| Test Article/substrate | Incubation time | Day 1: Log difference | Day 2: Log difference |
| PCA/plastic | 10 Min | -0.63 | -1.13 |
| PCA/Cloth | 10 min | -1.25 | -1.13 |
| PCA/Mesh | 10 min | -0.25 | -1.13 |
| PCA/plastic | 60 Min | -1.13 | -1.50 |
| PCA/Cloth | 60 min | -1.00 | -2.38 |
| PCA/Mesh | 60 min | -2.00 | -0.88 |
Summary:
A PCA coating on the three test substrates, appeared to show some effectiveness in reducing infectious virus titers in the experimental condition shown in the protocol after the 10 minutes and 60 minutes post-exposure incubation when compared to the virus control on substrate. From both the Day 1 and the Day 2 runs, the log reduction varied between a 0.63 to a 2.38 log reduction.
Overall, although overall effectiveness was somewhat varied between runs and test substrate, these results show that PCA. when coated approximately 24 hours prior to virus exposure, can reduce infectious virus performance on treated (PCA) substrates in both the drier and more aqueous test conditions of the Day 1 and Day 2 runs, respectively. Additionally, it appears that a longer incubation time may be slightly more effective than the shorter 10-minute time. For your reference, a 1 to 2 log reduction/difference corresponds to a 90 to 99% inactivation while a 3-log reduction corresponds to a 99.9% inactivation.
Respectfully Submitted,
Winston C. Lin, Ph.D.
Sr. Research Biologist
Microbiology and Molecular Biology Division
Life Sciences Group
Robert O. Baker, Ph.D.
Assistant Vice-President and Manager
Microbiology and Molecular Biology Division
Life Sciences Group
MRIGLOBAL
October 27, 2020 | MRIGlobal Project No.: 311645.01.001, “Assessment of Protocatechuic Acid Against SARS-CoV-2 in vitro”
Dear Dr. Johnson:
MRIGlobal is pleased to submit this letter report to you entitled “Assessment of Protocatechuic Acid Against SARS-CoV-2 in vitro.” The objective of this project was to determine if PCA-coated surfaces have the ability to inhibit the growth of SARS-CoV-2 in vitro. We coated three different materials (coupons) in protocatechuic acid (PCA) and added virus to each one, thereby creating an aqueous environment. Once dried, the virus was recovered and added to Vero E6 cells. Cells were observed for cytopathic effects (CPE) associated with viral infection at 4 days after virus addition. In general, PCA was very effective at inhibiting SARS-CoV-2 growth and infection of Vero cells.
Results Summary
The objective for MRIGlobal Project 311645.01.001 was to determine if PCA crystal coated surfaces have the ability to inhibit the growth of SARS-CoV-2 in vitro. MRIGlobal utilized the USA-WA1/2020 strain of the virus, acquired from BEI Resources (NR-52281). This was propagated in Vero E6 cells (ATCC CRL-1586); these cells were also used for the neutralization assay. Vero E6 cells were cultured in growth media consisting of Dulbecco’s Modified Eagle Medium/F12 supplemented with 5% FBS (Fetal Bovine Serum), and PSN (penicillin, streptomycin, and neomycin).
The Vero E6 cells were plated on 96-well plates the day before the assay and were allowed to grow to ~ 60%-70% confluence. 30% PCA w/v was made in 70% ethanol. Coupons made of K95 mask, stainless steel, and plastic were coated once with PCA, allowed to dry, coated a second time, and turned on the other side to dry and ensure an even coating. Once dry, (approximately 5 minutes per side, 10 minutes total) 200 µl undiluted virus was added to each coupon in triplicate and allowed to dry. Virus was re-suspended by adding 2 ml of DMEM/F12 to each coupon and washed over the coupon to retrieve virus without scraping off the PCA crystals. 120 µl of this suspension was added to an empty 96-well plate in 5 replicates. This was diluted 1:10 down the plate and then transferred to a plate of Vero E6 cells. After 45 minutes, 100 µl of DMEM/F12 + FBS was added to feed the cells. Additionally, cytotoxicity controls were done by performing the same procedure without adding virus to the coupons. This allows us to determine if PCA alone kills cells, which appears the same as CPE under the microscope.
We observed the growth of the Vero E6 cells and monitored for cytopathic effects (CPE) associated with successful virus replication. All wells were examined on Day 4 post infection. Examination is done using a microscope (usually 10x objective to view the entire well at once) to observe the morphology of the cells. Healthy Vero cells have a partially transparent appearance with pinched, or rounded ends in a monolayer of cells with little to no space between cells. Dead cells displaying CPE often do not adhere to the plate, are more rounded, and are much smaller than living cells. Additionally, empty space can be seen on the bottom of the plate from where cells have detached from the surface. Any well displaying CPE is marked as positive whether the whole well is affected or only a small area exhibits it, because this means viable virus is present.
Cytotoxicity was observed at 1:10 dilutions of media recovered from stainless steel (SS) and plastic (P) coupons and 1:10 and 1:100 dilutions of the media recovered from the K95 coupons. Since there was no CPE observed after the cytotoxic effects were gone, we cannot say for certain whether there was virus present in the wells that displayed cytotoxicity, thus limiting the quantification of viral reduction in these samples. Upon addition of DMEM/F12 to the PCA coupon, the pH indicator in the media changed from red to yellow, indicating an acidification of the liquid. Compared to controls, which were not coated with PCA, SS-PCA coupons displayed a 2.93 log (99.88%) reduction in viral growth, K95-PCA coated coupons displayed a 2.45 log (99.65%) reduction in viral growth, and P-PCA coated coupons displayed a 3.94 log (99.99%) reduction in viral growth. These results are summarized in Table 1.
Table 1. Results of PCA-coated coupon testing of SARS-CoV-2 in vitro
| Sample Name | Replicate No. | TCID50 | Log10 TCID50 | Average TCID50 | Average Log10 TCID50 | Log Reduction to Virus Controls | Percent Log Reduction |
| SS+PCA-1 | 1 | 5.01E+02 | 2.70 | 298.9493 | 2.37 | 2.93 | 99.88% |
| SS+PCA-2 | 2 | 7.94E+01 | 1.90 | ||||
| SS+PCA-3 | 3 | 3.16E+02 | 2.50 | ||||
| SS-1 | 1 | 8.80E+04 | 4.94 | 226075.8 | 5.29 | ||
| SS-2 | 2 | 3.16E+05 | 5.50 | ||||
| SS-3 | 3 | 2.74E+05 | 5.44 | ||||
| K95+PCA-1 | 1 | 3.16E+02 | 2.50 | 182.4589 | 2.10 | 2.45 | 99.65% |
| K95+PCA-2 | 2 | 2.00E+02 | 2.30 | ||||
| K95+PCA-3 | 3 | 3.16E+01 | 1.50 | ||||
| K95-1 | 1 | 5.82E+04 | 4.77 | 39285.11 | 4.55 | ||
| K95-2 | 2 | 2.00E+04 | 4.30 | ||||
| K95-3 | 3 | 3.97E+04 | 4.60 | ||||
| Plastic+PCA-1 | 1 | 5.01E+01 | 1.70 | 88.00117 | 1.91 | 3.94 | 99.99% |
| P+PCA-2 | 2 | 1.26E+02 | 2.10 | ||||
| P+PCA-3 | 3 | 8.80E+01 | 1.94 | ||||
| P-1 | 1 | 1.22E+06 | 6.09 | 971841.2 | 5.86 | ||
| P-2 | 2 | 2.04E+05 | 5.31 | ||||
| P-3 | 3 | 1.49E+06 | 6.17 |
Additionally, the same PCA-coated surfaces were tested for a 2-hour contact time with similar results. These are listed in Table 2.
Table 2. Results of 2 hour PCA-coated coupon testing of SARS-CoV-2 in vitro
| Sample Name | Replicate No. | TCID50 | Log10 TCID50 | Average TCID50 | Average Log10 TCID50 | Log Reduction to Virus Controls | Percent Log Reduction |
| Steel+PCA-1 | 1 | 5.01E+01 | 1.7 | 60.0702 | 1.77 | 2.33 | 99.53% |
| SS+PCA-2 | 2 | 5.84E+01 | 1.77 | ||||
| SS+PCA-3 | 3 | 7.17E+01 | 1.86 | ||||
| SS-1 | 1 | 7.94E+03 | 3.9 | 13495.05 | 4.1 | ||
| SS-2 | 2 | 1.26E+04 | 4.1 | ||||
| SS-3 | 3 | 2.00E+04 | 4.3 | ||||
| K95+PCA-1 | 1 | 3.16E+01 | 1.5 | 31.62278 | 1.5 | 2.35 | 99.55% |
| K95+PCA-2 | 2 | 3.16E+01 | 1.5 | ||||
| K95+PCA-3 | 3 | 3.16E+01 | 1.5 | ||||
| K95-1 | 1 | 5.01E+03 | 3.7 | 7251.46 | 3.85 | ||
| K95-2 | 2 | 7.94E+03 | 3.9 | ||||
| K95-3 | 3 | 8.80E+03 | 3.94 | ||||
| Plastic+PCA-1 | 1 | 5.84E+01 | 1.77 | 46.72521 | 1.66 | 2.71 | 99.81% |
| P+PCA-2 | 2 | 5.01E+01 | 1.7 | ||||
| P+PCA-3 | 3 | 3.16E+01 | 1.5 | ||||
| P-1 | 1 | 1.26E+04 | 4.1 | 25278.27 | 4.37 | ||
| P-2 | 2 | 3.16E+04 | 4.5 | ||||
| P-3 | 3 | 3.16E+04 | 4.5 |
Based on this experiment, we conclude that PCA is able to inhibit SARS-CoV-2 infection of Vero cells. It is important to note that the virus was in contact with PCA in liquid and dried forms, thus making it impossible to determine the exact mechanism of inhibition.
Sincerely,
MRIGlobal
Kristy Solocinski, Ph.D.
Staff Scientist
Medical Countermeasures Division
Approved by:
Claire Croutch, Ph.D.
Director
Medical Research Portfolio
Medical Countermeasures Division